
Manitoba Sector Profile: Public Administration
NAICS 91
- Workforce characteristics
- Main occupations
- Occupation of interest: Police officers (except commissioned) (NOC 42100)
Highlights
- In 2022, approximately 42,600 people were employed in Manitoba's public administration sector, representing 6.3% of total employment in the province.
- The average weekly earnings for public administration workers in Manitoba were $1,362.31/week in 2022 — 28.9% more than the average earnings for employees in the province.
- This sector is exclusively composed of public sector employees with 93.9% of workers employed on a full-time basis.
- The employment outlook for Manitoba's public administration sector will be limited to moderate from 2023 to 2025. Employment is expected to decline sharply in 2023 due to lower demand for pandemic response workers.
About the Sector
Composition and importance of the sector
This sector is comprised of establishments primarily engaged in activities of a governmental nature such as the application and interpretation of judicial laws and their accompanying regulations, and the administration of programs based on them. Legislative activities, taxation, national defence, public order and safety, immigration services, foreign affairs and international assistance, are activities that are purely governmental in nature. [1]
In 2022, there were 42,600 people employed in the public administration sector in Manitoba, representing 6.3% of total employment in the province. [2] Public administration contributed a total of $5.4 billion or 8.6% of Manitoba's gross domestic product (GDP) in 2022.

In 2022, the sector contributed to:
Source: Statistics Canada Labour Force Survey; Statistics Canada Table: 36-10-0402-01 (GDP at basic prices, chained 2012 dollars); Statistics Canada Table: 36-10-0400-01 (GDP at basic prices, current dollars)
Show graphic in plain text
Public administration employment is divided into five subsectors, four of which are present in Manitoba:
- NAICS 911 – Federal (makes up 41.5% of Manitoba's employment in this sector)
- NAICS 912 – Provincial (30.5%)
- NAICS 913 – Local, municipal, and regional (26.5%)
- NAICS 914 – Indigenous (1.2%)
- NAICS 919 – International and other extra-territorial public administration (not found in Manitoba)
Geographical distribution of employment
In 2022, 65.0% of total provincial employment in public administration was concentrated in the Winnipeg economic region. [3] This proportion reflects the population share for this region, which includes Manitoba's only Census Metropolitan Area (CMA). Central and regional offices for many government organisations are situated in the Winnipeg CMA such as the Canada Revenue Agency, Service Canada, the Government of Manitoba Legislative Assembly, and the City of Winnipeg. The remaining less densely populated regions have a much smaller share of employment in this sector, ranging from 4.7% in the South Central and North Central region to 8.7% in the Southeast region. [4]
Although the Winnipeg economic region has the largest share of employment in public administration in Manitoba, this sector represents less than 7% of total employment in Winnipeg. Meanwhile, employment in public administration represents almost 8% of total employment in the Interlake and Parklands and North economic regions. [5]
Workforce
Workforce characteristics
This sector is exclusively composed of public sector employees, with 93.9% of workers employed on a full-time basis. [6] An almost equal share of men (49.5%) and women (50.5%) are employed in Manitoba's public administration sector. [7] The provincial government sub-sector is also evenly divided with 48.5% male and 51.5% female employees. Meanwhile, more women work for the federal government (57.1%) while more men work for local, municipal, regional, and Indigenous governments (60.5%). [8]

94% of those employed worked full-time in 2022.
Source: Statistics Canada Labour Force Survey, ESDC custom table
Show graphic in plain text
There is a lower proportion of younger workers (15-24) and older workers (55 and over) in the public administration sector compared to the all-industry average. [9] Only 16.7% of public administration workers are 55 years or older compared to 19.5% of total workers in the province. Meanwhile, only 6.3% of public administration workers are aged 15 to 24 compared to 15.7% of total provincial employment.
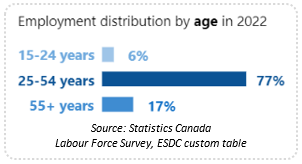
Employment distribution by age in 2022:
Source: Statistics Canada Labour Force Survey, ESDC custom table
Show graphic in plain text
Indigenous people made up approximately 17% of workers in the sector in 2022, significantly more than the all-industry average for this period (13.1%). [10]
In Manitoba, the average weekly earnings for those working in public administration in 2022 were $1,362.31/week. [11] This income is 28.9% more than the average weekly earnings for employees in Manitoba for the same period ($1,056.52/week). [12]
Public administration is a highly unionized sector in Canada, with 75.4% of employees in this sector were covered by a collective agreement in 2022. [13] Meanwhile, only 30.3% of total employees in all Canadian sectors were covered by a collective agreement in 2022. [14]
The public administration workforce in Manitoba also has a higher share of workers with a university education than the all-industry average. According to Census 2021, 37.4% of those working in the public administration sector in Manitoba have completed a bachelor's degree or higher while 28.4% of workers in Manitoba have the same level of education. [15]
Main occupations
In 2022, the top five most common occupations in Manitoba's public administration sector were non-commissioned police officers (7.5%), employment insurance and revenue officers (7.3%), correctional services officers (5.6% or 2,200), social policy researchers, consultants, and program officers (4.0%), and administrative assistants (4.0%). [16]
Occupation of interest: Police officers (except commissioned) (NOC 42100)
- Occupational Outlook: Employment prospects for police officers (except commissioned) will be good from 2023 to 2024.
- Duties: Include but are not limited to: Providing emergency assistance, patrolling public areas, arresting offenders and building community partnerships.
- Employment: 3,300 people were employed in this occupation in Manitoba in 2022, with 97% employed in the public administration sector.
- Education and Other Requirements: In Manitoba, completion of secondary school and a three-to-six-month police training program is required. Physical agility, strength, fitness, and vision requirements must be met, and psychological or other tests are also required.
- Wages: The median wage for police officers (except commissioned) in 2022 was $46.70/hour in Manitoba.
*Non-commissioned police officers include officers that hold a rank lower than staff sergeant.
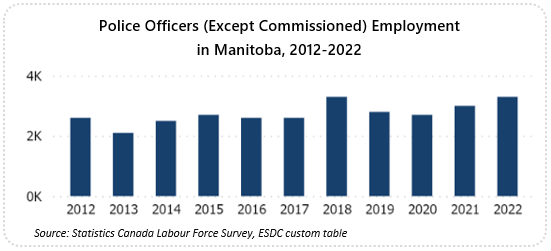
Police Officers (except commissioned) Employment in Manitoba
Note: Figures shown are employment estimates
Source: Statistics Canada Labour Force Survey, ESDC custom table
Show graphic in plain text
Year
Employment
2012
2,600
2013
2,100
2014
2,500
2015
2,700
2016
2,600
2017
2,600
2018
3,300
2019
2,800
2020
2,700
2021
3,000
2022
3,300
Recent History
Employment trends
Employment in public administration grew 12.4% in 2022. This increase was led by gains in local, municipal, and regional public administration — up 22.8% for this period (+2,100). Employment also increased in the federal (+8.6% or +1,400) and provincial (+10.2% or +1,200) public administration subsectors. Meanwhile, employment in Indigenous public administration remained unchanged.

Public Administration Employment
Note: Figures shown are employment estimates. Totals may not add to 100% due to rounding.
Source: Statistics Canada Labour Force Survey, ESDC custom table
Show graphic in plain text
Year
Employment (Total)
Full-time
Part-time
2012
35,300
33,200
2,100
2013
33,400
31,600
1,700
2014
34,200
32,300
1,900
2015
33,400
31,600
1,800
2016
32,300
30,400
1,900
2017
33,500
31,100
2,300
2018
35,900
34,100
1,800
2019
37,200
35,300
1,900
2020
36,100
34,000
2,100
2021
37,900
35,800
2,100
2022
42,600
40,000
2,600
COVID-19
Looking back over the last five years, employment in the public administration sector has been on an upward trend, except for 2020. In the first year of the pandemic there was a 3.0% (-1,100) overall decrease in public administration employment only partially offset by a 2.8% increase the federal public administration subsector (+2.8% or +400).
In 2021, employment in public administration increased 5.0% (+1,800) bolstered by robust gains in federal jobs. By 2022, all three subsectors grew substantially for an overall annual employment increase of 12.4% (+4,700). Employment growth was due in part to increased staffing for all levels of government, in order to implement and administer programs that address the impact of the COVID-19 pandemic.
Telework
While many employees within the public administration sector were able to switch their place of employment from the office to their home during the pandemic and beyond, others were unable to do so due the nature of their work. According to the 2021 Census, 26.9% of all those working in public administration in Manitoba were working from home at the time of the survey compared to 17.0% of the total number of workers in the province. [17] Within the subsectors, federal workers had the highest proportion of teleworkers (39.6%) followed by provincial employees (24.5%), and local, municipal, and regional government employees (11.1%). Indigenous public administration employees had the lowest proportion of teleworkers of any subsector (6.5%). [18]
Labour disruptions
In 2023, several federal and provincial unions representing public administration employees in Manitoba and throughout the country engaged in various forms of strike action, in an effort to negotiate wage increases in line with inflation. [19] In May, the Public Service Alliance of Canada (PSAC), which includes over 8,800 members in Manitoba, signed a new agreement with the Treasury Board after a 12-day strike. Shortly after, PSAC's Union of Taxation Employees signed an agreement with the Canada Revenue Agency (CRA) following a 15-day strike. [20], [21] During the summer, about 1,400 Manitoba Government and General Employees' Union (MGEU) members who work for Manitoba Liquor and Lotteries (MBLL) took part in province-wide strike action. [22] Half of the 70 unionized MGEU workers at Manitoba Land Titles offices also went on strike due to a lack of progress in negotiating a general wage increase that reflects rising costs of living. [23]
Indigenous public administration
In 2022 the NAICS system was updated to rename NAICS 91411 Aboriginal public administration to Indigenous public administration and split-off into three new national industries (914111) First Nations public administration, (914112) Métis public administration, and (914113) Inuit public administration. [24] This development reflects an evolving public administration sector that includes increased self-governance initiatives occurring throughout the country. These events could help increase Indigenous public administration employment beyond the 500 jobs seen in 2021 and 2022.

Subsector Employment
Note: Figures shown are employment estimates. Missing values indicate data that has been suppressed.
Source: Statistics Canada Labour Force Survey, ESDC custom table
Show graphic in plain text
Year
Federal
Provincial
Municipal
Indigenous
2012
13,400
12,800
8,400
700
2013
12,300
13,100
7,600
-
2014
12,500
11,900
9,100
700
2015
11,600
12,400
8,700
700
2016
12,300
11,100
8,600
-
2017
12,800
11,800
8,400
500
2018
13,200
11,900
10,100
600
2019
14,100
13,200
9,300
500
2020
14,500
12,400
8,800
-
2021
16,300
11,800
9,200
500
2022
17,700
13,000
11,300
500
Employment Outlook
Employment prospects for public administration are expected to be limited to moderate in Manitoba throughout the 2023 to 2024 forecast period. Key factors that influence this outlook include shifts in the economic climate of the province, reduction in COVID-19 spending, and growing opportunities in Indigenous public administration.
Financial pressures
The public administration sector's employment outlook is constantly vulnerable to change, as it's normal for governments to shift priorities amidst increasing financial pressures and look to improve operational efficiencies. Any economic downturn, or indications of an upcoming downturn, can suddenly temper employment growth in this sector. Furthermore, both wage increases from newly negotiated collective agreements and rising cost of living may contribute to reduction in worker turnover and constrain employment growth, as public sector employment provides a level of employment security during times of economic uncertainty.
COVID-19 recovery
Hiring at all levels of government for COVID-19 response and administration of related programs has provided a significant boost to public administration sector employment in recent years. As pandemic recovery progresses, less funding is needed to support affected households and businesses and enforce public health safety measures. The City of Winnipeg has forecasted $21.5 million in COVID-19 funding in 2023, which is down from $73.0 million in 2021 and $53.7 million in 2022. Moreover, the Conference Board of Canada reports that public administration employment in Winnipeg economic region will decline sharply in 2023 as the demand for pandemic response workers decreases. [25]
Indigenous public administration
Manitoba currently has a mix of significant Indigenous-led governance and community development initiatives underway that will bolster Indigenous public administration employment. Significant initiatives include:
- The Manitoba Métis Federation (MMF) spending $21M to purchase the former Wawanesa Insurance building in downtown Winnipeg. The new space will house MMF offices and programs, employing about 250 people. Plans include an onsite day care centre for the children of staff. [26]
- Development of a New First Nations Health Authority. [27]
- Adoption of Bill C-92 by some Indigenous communities to reclaim jurisdiction of their own child and family services. [28]
- Seven Treaty One Nations partnering to develop 160 acres of the former Kapyong Barracks site in Winnipeg. The site will be transformed into the $1 billion Naawi-Oodena development and the largest First Nations economic zone in Canada that will serve as a model for Indigenous self-governance. [29]
Endnotes
-
Statistics Canada. North American Industry Classification System (NAICS) Canada 2022 Version 1.0. Accessed July 20, 2023. ↑
-
Statistics Canada. ESDC custom table. ↑
-
Statistics Canada. ESDC custom table. ↑
-
Ibid. ↑
-
Statistics Canada. ESDC Custom Table. ↑
-
Statistics Canada. Table 14-10-0023-01 (formerly CANSIM 282-0008) Labour force characteristics by industry, annual (x1,000). Accessed on July 20, 2023. ↑
-
Ibid. ↑
-
Statistics Canada. ESDC Custom Table. NOTE: Due to data restrictions, we are unable to parse out Indigenous public administration by gender from the total for local, municipal, regional and Indigenous public administration within the ESDC Custom Table. ↑
-
Statistics Canada. Table 14-10-0023-01 (formerly CANSIM 282-0008) Labour force characteristics by industry, annual (x1,000). Accessed on May 2, 2023. ↑
-
Statistics Canada. ESDC Custom Table. ↑
-
Statistics Canada. Table 14-0204-01 (formerly CANSIM 281-0027) Average weekly earnings by industry, annual. Accessed on July 20, 2023. ↑
-
Ibid. ↑
-
Statistics Canada. Table: 14-10-0132-01 (formerly CANSIM 282-0223) Union status by industry. Accessed July 31, 2022. ↑
-
Ibid. ↑
-
Statistics Canada. Census 2021, Table 98-10-0588-01 Employment income statistics by industry sectors, Indigenous identity, highest level of education, work activity during the reference year, age and gender: Canada, provinces and territories, census metropolitan areas and census agglomerations with parts. Accessed July 28, 2023. ↑
-
Statistics Canada. ESDC custom table. ↑
-
Statistics Canada. Table: 98-10-0455-01 Place of work status by industry subsectors, occupation broad category, age and gender: Canada, provinces and territories, census metropolitan areas and census agglomerations with parts. Accessed July 31, 2023. ↑
-
Ibid. ↑
-
CTV News (July 10, 2023). More than half of Canadians $200 away or less from not being able to pay all their bills. ↑
-
CBC News (April 19, 2023). Nearly 9,000 public sector workers on strike in Manitoba. ↑
-
CTV News (May 7, 2023). Tentative agreements give public servants additional $23,000 on average: PSAC. ↑
-
CTV News (July 30, 2023). Liquor mart workers to return to work as strike action continues. ↑
-
CBC News (August 11, 2023). Strike at Manitoba's land titles offices expands after weeks of job action. ↑
-
Statistics Canada. Introduction to the North American Industry Classification System (NAICS) Canada 2022 Version 1.0. Accessed August 14, 2023. ↑
-
The Conference Board of Canada (May 4, 2023). Conference Board of Canada Major City Insights: Winnipeg – May 2023. ↑
-
Winnipeg Free Press (September 28, 2023. MMF announces purchase of former Wawanesa building. ↑
-
Southern Chiefs' Organization Inc. Health transformation at SCO. Accessed August 14, 2023. ↑
-
Government of Canada. Notices and requests related to An Act respecting First Nations, Inuit and Métis children, youth and families. Accessed August 14, 2023. ↑
-
Winnipeg Free Press (June 15, 2022). Largest urban reserve worth $500M in GDP, 5,000 jobs. ↑
Page details
- Date modified: